US500, H4
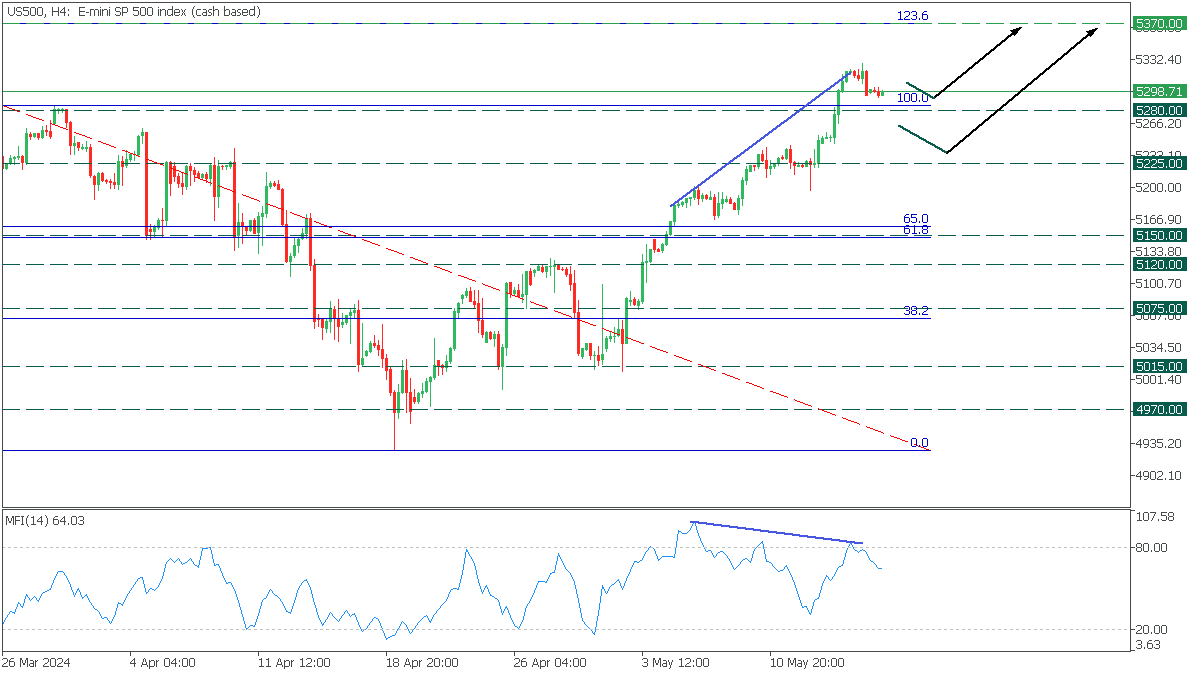
The US500 has broken above the 5280 resistance, which aligns with the 100 Fibonacci retracement. The price is now aiming to retest the support. The Money Flow Index (MFI) oscillator indicates a bearish divergence with the asset, suggesting a corrective move before any further rise.
- If the price rebounds from the 5280 level, it will likely rise towards the 5370 resistance.
- However, if the US500 breaches below the support, it will test the 5225 level before moving to 5370 again.
Conclusion
In conclusion, trading CFDs carries inherent risks. Success in this field demands effective risk management. To minimize costly errors and capitalize on trading opportunities, it's crucial to conduct thorough due diligence and manage risks diligently.